Changelog
See what's new with Windmill.
1/11/2024 |
Docs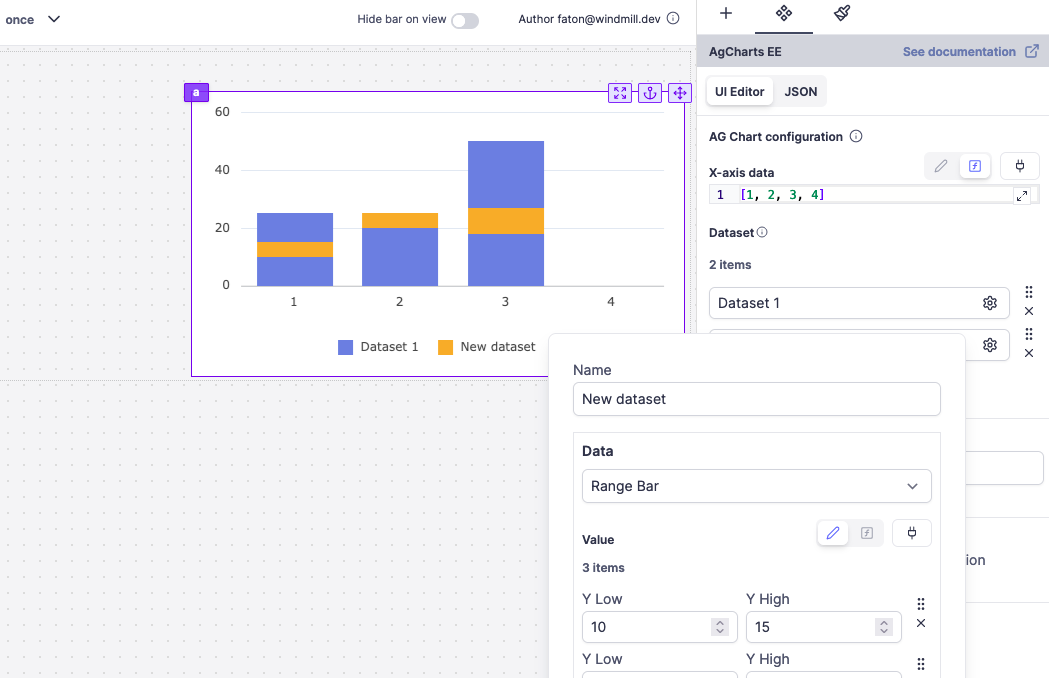
The Ag Charts component integrates the Ag Charts library, enabling the visualization of data through various chart types. This component is designed to offer a flexible and powerful way to display data graphically within the application.
New Features
- Chart Display: Leverages the Ag Charts library to present data in a visually appealing chart format.
- Diverse Chart Types: Supports multiple chart types including Bar, Line, Scatter, and both Area & Range Bar that are exclusive to Enterprise Edition (because Ag Charts key needed).